
Wind and solar energy cannot lift humanity into prosperity. But as an impressive fleet of private jets has recently migrated from the COP 28 Summit in Dubai to the World Economic Forum in Davos, carrying the hoi polloi of the world from one elitist summit to another, this delusion was the dominant sentiment. In this three-part analysis, what can accurately be described as a collective, perhaps willful delusion will be exposed in excruciating detail. It will be dry and tedious reading. And perhaps that’s why journalists, activists, bureaucrats, and politicians have accepted the delusion. So buckle up. Here’s the other side of the story.
Part One will quantify how much global energy production will need to increase if humanity is to have any hope of achieving universal energy security, much less energy abundance. Part Two will calculate the infeasible degree to which wind and solar energy production will have to increase in order to hit that minimum target while still fulfilling the goals of COP 28. Part Three will conclude by examining non-fossil fuel alternatives to wind and solar and, in so doing, demonstrate why global energy security is impossible to achieve without increasing, not decreasing, reliance on coal, oil, and gas.
An article published in the New York Post shortly after the war in Ukraine began in early 2022 nicely encapsulated what might be described as the “energy realist” perspective in the ongoing debate over climate and energy. In his article entitled “If the Ukraine war hasn’t scared the West straight on energy, nothing will,” author Rich Lowry reminded us, “The world hasn’t embraced fossil fuels out of hatred of the planet but because they are so incredibly useful.”
Even if some claim there is only an alleged consensus on the potentially catastrophic threat represented by fossil fuels, there is widespread agreement on the direct connection between energy and prosperity. With that in mind, and to make clear how critical it is to produce more energy worldwide, much more, here’s an immutable fact, based on data reported in the 2023 edition of the Energy Institute’s Statistical Review of World Energy: For everyone on earth to have access to half the energy per capita that Americans consume, global energy production will have to double.
To be precise, since this is a statistic that carries huge implications, in 2022, according to the World Bank, total world population was 7.954 billion. In 2022, according to the Energy Institute, total world energy consumption was 604.0 exajoules. In that same year, there were 333.3 million Americans, consuming a total of 95.9 exajoules. That means that in 2022, the average American consumed 288 gigajoules, while the other 7.62 billion people in the world consumed, per capita, a mere 67 gigajoules.
This is not difficult math. It isn’t necessary to understand that a billion gigajoules equals an exajoule, or that most energy economists now convert all forms of measurable energy use—coal, gas, oil, solar, wind, geothermal, biomass, biofuel, hydro, and nuclear—into joules to have a common unit for analysis. It is only necessary to know that these units and conversion ratios adhere to well-established, credible methodologies that are accepted worldwide and that 288 gigajoules, which the average American consumed in 2022, is more than four times as much energy as what people in the rest of the world consumed in 2022, 67 gigajoules.
In further pursuit of precision, and to let this sink in, consider the exact amount by which global energy production would have to increase based on various estimates of the levels at which the global population will peak. If the world population had stayed at 2022 levels, and if everyone (including Americans) consumed half as much energy per capita as Americans consumed in that year, global energy production would have to increase by 89 percent. That is, it would only have to nearly double. But the global population continues to increase.
As of January 2024, the global population is already estimated at 8.1 billion, and despite dwindling birth rates everywhere on earth except in Africa, parts of the Middle East, and Central America, the United Nations currently projects the global population to peak at 11.2 billion before the end of this century.
Again, the math is not difficult. If the global population reaches 9 billion, as it almost certainly will, for everyone on earth (including Americans) to use half as much energy as Americans did in 2022, global energy production would have to increase by 114 percent—more than doubling. At a global population of 10 billion, under these same constraints, energy production would have to increase by 138 percent over 2022 levels.
How Will Global Energy Production Double?
There is some good news in all this. Because the first question anyone still willing to wade through these numbers ought to ask is: How on earth will Americans, or anyone else for that matter, enjoy a so-called First World quality of life if they only have access to half as much energy as they currently use? The answer to this question lies in the distinction between energy inputs and energy services, which constitutes the strongest case for electrifying the economy.
The following flowchart from Lawrence Livermore National Laboratory provides an intuitive visualization of the difference between energy inputs and energy services. The most recent available chart is dated 2011, when total world energy flow (please don’t be alarmed, the units used on this chart are petajoules, abbreviated as PJ. Every 1,000 petajoules is equal to one exajoule) was estimated at 534 exajoules. But those 534 exajoules were energy inputs, depicted on the left side of the flowchart, not energy services, which are depicted on the right side of the flowchart.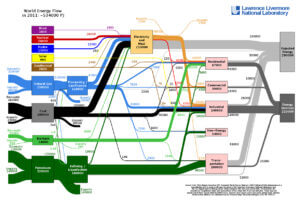
Apart from the fact that these datasets reveal total global energy production between 2011 and 2022 to have only increased by 13 percent in over a decade, which is not an encouraging rate of growth if our objective is to double global energy production, the critical variables to examine on this flowchart are how, despite inputting 534 exajoules worth of mostly coal, petroleum, and natural gas fuel, 290 exajoules of that was “rejected energy,” and only 210 exajoules were actual “energy services.”
What this means is that only 40 percent of the energy we burned, boiled, generated, or otherwise extracted from natural sources was ultimately enjoyed as heating and cooling in our homes and businesses, traction for our cars and trucks, propulsion for our airplanes, electricity for our appliances, computers, communications, media, and so on. The rest was lost to heat and friction.
The technological state of the global energy economy today is such that 60 percent of the energy we put into the system is lost. More recent corroboration of this assumption comes from the 2023 edition of the Statistical Review of Global Energy, where in the appendix they state their energy conversion efficiency assumptions as follows: “2000-2017: a linear increase from 36% to 40%… the assumption [is] that efficiency will increase linearly to 45% by 2050.”
Using new energy technologies to greatly improve conversion efficiency spells an opportunity with world-changing potential. If we could lift our efficiency from 40 to 80 percent, then in order to enjoy the same level of energy services we currently consume, we would only have to supply a raw energy input of 25 percent in excess of what we intend to consume in services, instead of the current 60 percent.
Expressed in actual units of energy, that means that in 2022, at 40 percent efficiency, the 604 exajoules of raw energy input into the economy yielded energy services of 242 exajoules. If the devices we use to convert energy inputs into energy services were to double to a conversion efficiency of 80 percent, everyone in the world would already have access to twice as much usable energy.
The technologies that are purported to have this potential include EVs and batteries, which can convert electricity into traction, including the charge/discharge cycle of the battery and taking into account regenerative braking, at around 80 percent, whereas it is rare for any vehicle with an internal combustion engine to achieve better than 40 percent efficiency. Similarly, electrification proponents claim the latest heat-pump technology utilizes electricity for space heating far more efficiently than natural gas heaters.
While there is ongoing debate over just how much efficiency is gained by moving from an energy economy based primarily on fossil fuel combustion to one based primarily on electricity, it is clear that the efficiency of many energy services can be greatly improved by going electric. The promise of extraordinary gains in energy efficiency is the reason it may be realistic to set a total world energy production target at around 1,000 exajoules, which is not quite double the currently estimated 604 exajoules set in 2022. The next chart shows how this works out numerically.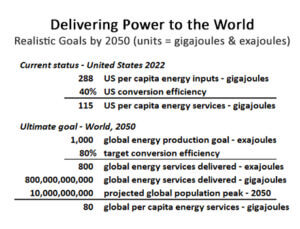 There are huge assumptions in this chart. All of them error in the direction of potentially underestimating how much total global energy may be adequate to lift all of humanity into prosperity. The global population may exceed 10 billion. Retooling the entire energy economy of the world to achieve 80 percent efficiency between raw inputs and end-user energy services would be an extraordinary achievement. And even if we did succeed in deploying new technologies everywhere in order to harvest 80 percent of our raw energy input in the form of end-user energy services, it is extremely unlikely we could do this without using coal, oil, and gas.
Increasing global energy production to 1,000 exajoules from the current 604 in just 26 years is a Herculean task, arguably impossible without resorting to an all-of-the-above energy development strategy. Part two will present the current global fuel mix and, using the guidelines agreed upon at the recent COP 28 summit in Dubai, present their proposed future global fuel mix. These calculations will demonstrate that the amount of wind and solar expansion necessary to adhere to COP 28 guidelines while still producing the minimum total energy worldwide is far greater than is generally understood or acknowledged.
More to the point, the calculations in the next installment will demonstrate the absolute absurdity of pretending that reliance on wind and solar energy is a viable strategy. The reader may then determine if the catastrophic consequences of adhering to an energy strategy that is an obvious failure might merit a more forceful repudiation of the entire “net zero” agenda. Adaptation, not “net zero,” is the only rational response to whatever theories of climate may remain in vogue.